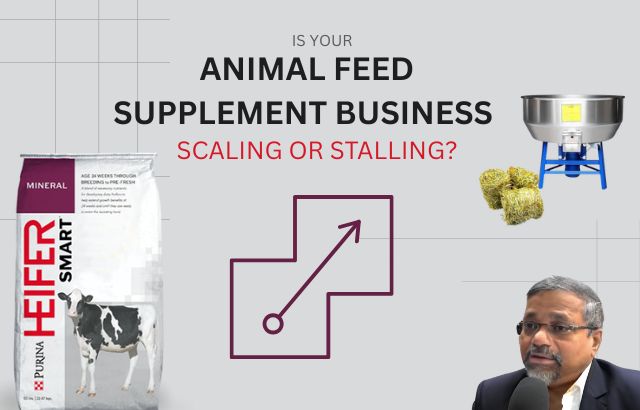
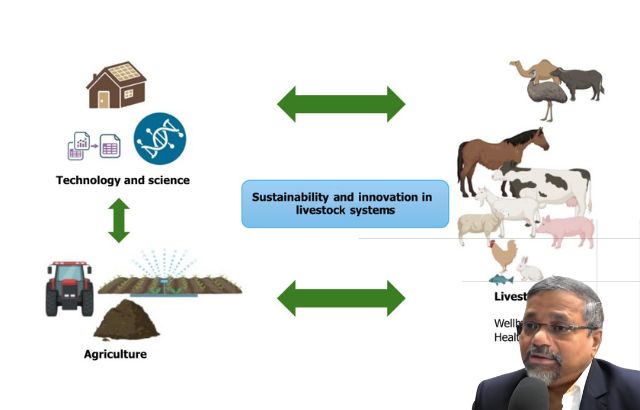
The Animal Feed Supplement Industry is expanding rapidly due to increasing demand for efficient livestock production, antibiotic alternatives, precision nutrition, and sustainable farming practices. However, growth in the industry is not automatic. Many businesses operate for years without validating whether they are truly progressing or simply maintaining activity without direction.
This article outlines five strategic checkpoints to assess business direction, featuring insights from Green Innovator Jaiguru Kadam, a Subject Matter Specialist with extensive global expertise in feed nutrition, sustainability, and performance optimization.
About Jaiguru Kadam
Jaiguru Kadam is a recognized expert in animal nutrition science and sustainable feed innovation. With experience across Asia, Europe, and the Americas, he has worked with feed manufacturers, livestock integrators, dairy cooperatives, and research institutions.
His core expertise includes:
- Development of performance-driven feed supplements
- Sustainable and eco-conscious formulations
- Technical-commercial strategy alignment
- Scale-up strategies for manufacturing industries
- Global regulatory compliance advisory
He is widely known for integrating scientific precision with business scalability.
Checkpoint 1: Measurable Improvement in Animal Performance
The first indicator of business direction is product performance.
Key Performance Indicators include:
- Feed Conversion Ratio (FCR)
- Average Daily Gain (ADG)
- Milk yield per animal
- Mortality and morbidity rates
Example Calculation
A poultry integrator reports:
Baseline FCR = 2.1
Improved FCR after supplement use = 1.9
Improvement = 0.2
If a farm produces 1,000 tons of live weight annually:
Feed saved per kg = 0.2 kg
Total feed saved = 0.2 × 1,000,000 kg
= 200,000 kg feed saved
If feed cost = ₹30 per kg
Savings = 200,000 × 30
= ₹6,000,000 annually
Even a small biological improvement translates into major financial gains.
Jaiguru Kadam emphasizes that measurable biological outcomes must always be linked with financial metrics.
Checkpoint 2: Product Innovation and Differentiation
In large markets, undifferentiated products become commodities. Margins shrink rapidly.
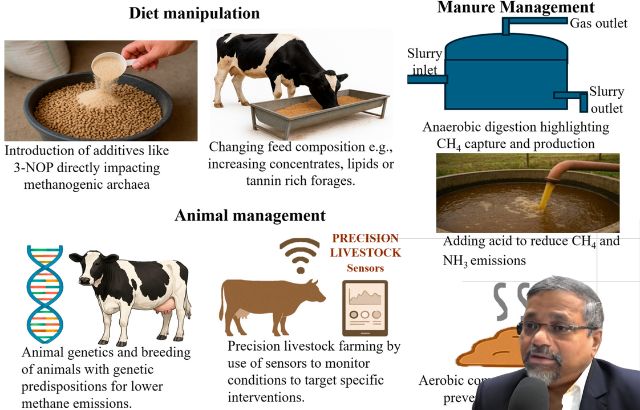
Forward-looking businesses invest in:
- Phytogenic feed additives
- Enzyme complexes
- Probiotic and prebiotic blends
- Methane-reduction supplements
- Precision mineral chelation technologies
Innovation must be supported by:
- Controlled field trials
- Data-backed claims
- Peer-reviewed validation where possible
Jaiguru’s approach focuses on designing solutions around defined production problems rather than creating generic formulations.
Checkpoint 3: Scalable Market Expansion

Growth is validated by structured expansion, not random sales increases.
Example Calculation
Current customer base: 5,000 dairy farms
Average annual sales per farm: ₹45,000
Revenue = 5,000 × 45,000
= ₹225,000,000
If market penetration doubles to 10,000 farms:
Revenue = 10,000 × 45,000
= ₹450,000,000
Expansion must be supported by:
- Strong distributor networks
- Technical advisory teams
- Regional cluster mapping
- Export readiness
Jaiguru Kadam recommends segment-based expansion — by species, geography, and production system — instead of broad unstructured scaling.
Checkpoint 4: Compliance, Quality, and Sustainability
Large buyers now demand traceability and transparency.
Critical elements include:
- Regulatory approvals for active ingredients
- Batch traceability systems
- Good Manufacturing Practices (GMP)
- Hazard Analysis and Critical Control Points (HACCP)
- Environmental sustainability metrics
Sustainability drivers include:
- Reduced antibiotic dependency
- Lower methane emissions
- Reduced nitrogen excretion
- Efficient nutrient absorption
Compliance is no longer optional. It determines eligibility for export and integration into large supply chains.
Checkpoint 5: Financial Efficiency and Manufacturing Optimization
For large-scale manufacturing industries, direction is validated by operational discipline.
Key metrics:
- Production capacity utilization
- Cost per metric ton
- Raw material yield efficiency
- Inventory turnover ratio
- Energy consumption per batch
- Downtime percentage
Example
If plant capacity = 10,000 MT per month
Actual production = 7,000 MT
Capacity utilization = 70%
Increasing utilization to 85% significantly reduces per-unit fixed cost burden.
Jaiguru emphasizes aligning R&D, procurement, and production to avoid inefficiencies caused by fragmented decision-making.
Additional Strategic Guidelines for Large Manufacturing Industries

For companies operating at scale in the Animal Feed Supplement Industry, the following guidelines are critical:
- Integrate R&D with Market Intelligence
Product development must be driven by real field challenges and evolving livestock management trends. - Establish Data Analytics Systems
Digital dashboards tracking FCR improvements, sales conversion, and regional performance enable predictive planning. - Strengthen Raw Material Security
Develop multi-supplier sourcing strategies for critical ingredients such as amino acids, trace minerals, and phytogenic extracts. - Invest in Automation
Automated batching and dosing systems reduce formulation error and increase consistency. - Focus on ESG Compliance
Environmental, Social, and Governance metrics influence investor confidence and international partnerships. - Develop Technical Training Programs
A technically informed sales force improves value communication and customer retention. - Build Global Regulatory Intelligence
Understand regulations across regions before entering export markets. - Conduct Annual Strategic Direction Audits
Evaluate whether product portfolio, capacity planning, and financial goals are aligned.
Real-World Dairy Example

A dairy cooperative introduced a mineral and rumen buffer supplement.
Before introduction:
Milk yield = 18 liters per day
After 60 days:
Milk yield = 20 liters per day
Increase = 2 liters per cow
For 1,000 cows:
2 × 1,000 = 2,000 extra liters per day
If milk price = ₹35 per liter
Daily additional revenue = 2,000 × 35
= ₹70,000
Monthly additional revenue (30 days)
= ₹2,100,000
This demonstrates how biological improvement directly drives business performance.
Frequently Asked Questions
- How can a large manufacturer know if growth is sustainable?
Monitor margin consistency, capacity utilization, repeat customer ratios, and innovation rate. - What is the ideal R&D investment percentage?
For competitive manufacturing industries, 3–7% of annual revenue is often allocated toward R&D, depending on scale and ambition. - When should a company expand internationally?
Only after ensuring regulatory compliance, quality consistency, and reliable logistics. - How frequently should performance data be reviewed?
Quarterly at the strategic level, monthly at the operational level. - What is the biggest risk in this industry?
Overproduction without demand validation and lack of differentiation.
Final Reflection
In the Animal Feed Supplement Industry, movement is not the same as progress. True progress is validated through measurable biological impact, structured expansion, financial discipline, compliance readiness, and innovation alignment.
As Jaiguru Kadam often states, growth becomes sustainable when science, strategy, and scalability operate together.
If your organization can demonstrate improvement across these five checkpoints, it is moving in the right direction. If not, it is time for a structured strategic reassessment.