By Jaiguru Kadam, Subject Matter Specialist
Green innovation is no longer simply about installing solar panels, buying electric vehicles, or replacing plastic with a “greener” material. The harder question for organisations is: Which sustainability initiatives deserve immediate investment, which should be strategically planned, which can be delegated or embedded into operations, and which should be avoided?
This is where a familiar management tool—the Eisenhower Matrix—can become surprisingly powerful.
Originally designed to distinguish between what is urgent and what is important, the matrix can be adapted for sustainability decision-making. It helps companies avoid a common problem: spending disproportionate resources on highly visible environmental projects while neglecting less glamorous initiatives that produce larger and faster reductions in energy use, waste, emissions and operating costs.
The global innovation landscape makes this prioritisation increasingly important. Many of the technologies required for deep decarbonisation are still moving from demonstration to commercial-scale deployment. At the same time, organisations face growing pressure from climate risks, resource constraints, energy costs, regulation and changing customer expectations.
The implication is clear: green innovation requires both technological ambition and disciplined prioritisation.
The Green Innovation Eisenhower Matrix
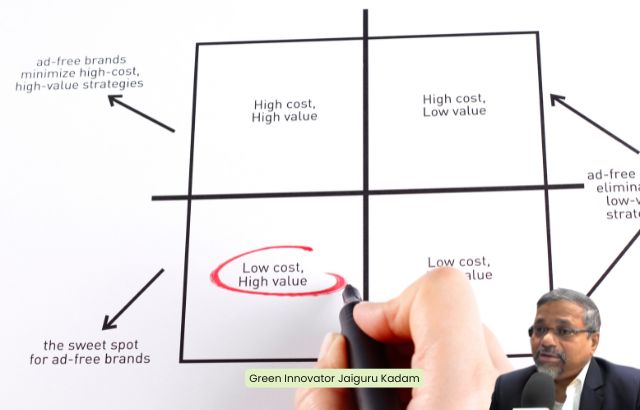
A sustainability-oriented Eisenhower Matrix can be structured around two dimensions:
- Urgency: How quickly must the organisation respond because of energy costs, regulation, climate risk, resource scarcity, customer expectations or operational exposure?
- Importance/impact: How significantly can the initiative improve environmental performance, resilience, efficiency and long-term competitiveness?
This creates four strategic categories:
| Quadrant | Sustainability priority | Typical examples | Recommended action |
|---|---|---|---|
| I: Urgent + Important | Immediate impact | Energy waste, regulatory compliance, high-emission processes, water leakage | Act now |
| II: Important + Not Urgent | Transformational innovation | Renewable-energy transition, circular product design, electrification, low-carbon manufacturing | Plan and invest |
| III: Urgent + Less Important | Operational pressure | Short-term reporting requests, minor certification demands, isolated stakeholder requests | Simplify/delegate |
| IV: Not Urgent + Less Important | Low-value sustainability activity | Symbolic initiatives without measurable impact, poorly targeted offsets, excessive reporting without action | Eliminate/reconsider |
The most strategically important insight is that Quadrant II is where many organisations should spend more time.
Quadrant I protects today’s performance. Quadrant II creates tomorrow’s competitive advantage.
1. Quadrant I: Attack Waste Before Buying New Technology
A common misconception is that green innovation always means adopting an advanced technology.
It doesn’t.
Sometimes the most effective innovation is identifying an inefficient process and redesigning it.
Consider a hypothetical manufacturing facility consuming 10 million kWh of electricity annually. Suppose an energy audit identifies avoidable consumption equal to 8%.
Energy savings=10,000,000×8%Energy\ savings = 10,000,000 \times 8\%
=800,000 kWh/year= 800,000\ kWh/year
If electricity costs $0.12/kWh:
Annual savings=800,000×$0.12Annual\ savings = 800,000 \times \$0.12
=$96,000/year= \$96,000/year
If the efficiency programme costs $150,000:
Simple payback=$150,000$96,000Simple\ payback = \frac{\$150,000}{\$96,000}
≈1.56 years\approx 1.56\ years
This is why energy efficiency belongs firmly in Quadrant I when waste is material.
The sustainability benefit can be calculated as well. If the facility’s electricity emissions factor is assumed to be 0.4 kg CO₂e/kWh:
CO2e reduction=800,000×0.4CO₂e\ reduction = 800,000 \times 0.4
=320,000 kg= 320,000\ kg
or approximately 320 tonnes CO₂e per year.
The actual emissions factor should be based on the relevant grid or contractual electricity data rather than this illustrative assumption.
Jaiguru Kadam’s perspective
“Before asking what new green technology we should purchase, organisations should ask a more fundamental question: Where are we currently wasting energy, materials, water and productive capacity? Efficiency is often the first innovation because it improves both environmental and financial performance.”
2. Quadrant II: Invest in Transformational Green Innovation
This is the quadrant that determines whether a company merely becomes more efficient—or fundamentally changes its business model.
Examples include:
- Renewable electricity and long-term power purchase agreements
- Electrification of industrial processes
- Green hydrogen for hard-to-abate applications
- Battery storage
- Carbon capture where technically and economically appropriate
- Product-as-a-service models
- Industrial symbiosis
- Design for repair, reuse and remanufacturing
- Low-carbon cement and steel
- AI-enabled energy optimisation
- Digital product passports and material traceability
But there is a strategic warning here.
Innovation is not the same as deployment.
A technology can be technically impressive yet commercially premature.
Therefore, a sustainability investment should be assessed across at least five dimensions:
Innovation Value=Environmental Impact+Economic Return+Scalability+Resilience+Strategic FitInnovation\ Value = Environmental\ Impact + Economic\ Return + Scalability + Resilience + Strategic\ Fit
A technology that scores highly on laboratory performance but poorly on scalability may belong in a pilot programme rather than a full-scale capital investment.
3. Renewable Energy: From Sustainability Project to Cost Strategy
Renewable energy provides a good example of why green innovation should be evaluated economically as well as environmentally.
Suppose a company consumes 20 GWh of electricity annually and moves 50% of that demand to renewable electricity.
Renewable electricity=20×50%Renewable\ electricity = 20 \times 50\%
=10 GWh/year= 10\ GWh/year
If the relevant avoided-emissions factor were 0.45 tCO₂e/MWh:
10,000 MWh×0.4510,000\ MWh \times 0.45
=4,500 tCO2e/year= 4,500\ tCO₂e/year
Again, this is an illustrative calculation; the actual factor depends on location, electricity procurement method and accounting methodology.
Corporate renewable-energy contracts can also provide price visibility. A power purchase agreement, or PPA, is a contract between a corporate buyer and electricity producer specifying commercial terms such as duration, volume and price.
The key lesson is that renewable procurement should not be evaluated solely on “percentage renewable.”
A stronger dashboard would track:
- Renewable electricity percentage
- MWh consumed
- Energy cost per unit of production
- Scope 2 emissions
- Contracted versus actual renewable generation
- Renewable-energy cost variance
- Payback or net present value where capital is invested
4. Circular Economy: Innovation Beyond Recycling
Circular innovation asks a more ambitious question:
Can we prevent material from becoming waste in the first place?
The hierarchy should generally move from:
Reduce → Reuse → Repair → Remanufacture → Recycle → Dispose
rather than treating recycling as the entire circular-economy strategy.
A circular strategy considers how products are designed, manufactured, distributed, used, repaired and eventually recovered.
A simple circularity calculation
Imagine a manufacturer uses 1,000 tonnes of virgin material annually.
A redesigned product reduces material requirements by 15%:
Material reduction=1,000×15%Material\ reduction = 1,000 \times 15\%
=150 tonnes= 150\ tonnes
If the company then substitutes 30% of its remaining material requirement with recycled input:
Remaining demand=850 tonnesRemaining\ demand = 850\ tonnes
Recycled material=850×30%=255 tonnesRecycled\ material = 850 \times 30\% = 255\ tonnes
Virgin-material requirement becomes:
850−255=595 tonnes850 – 255 = 595\ tonnes
Compared with the original 1,000 tonnes, virgin material demand falls by:
1,000−5951,000×100=40.5%\frac{1,000-595}{1,000}\times100 =40.5\%
That is a more meaningful innovation outcome than simply reporting “we increased recycling.”
5. Scope 1, 2 and 3: Measuring the Real Carbon Footprint
Green innovation cannot be managed effectively without credible measurement.
The GHG accounting structure commonly divides emissions into three scopes:
- Scope 1: Direct emissions from owned or controlled sources, such as company boilers or vehicles.
- Scope 2: Indirect emissions associated with purchased electricity, heat or steam.
- Scope 3: Other indirect emissions throughout the value chain, including purchased goods, transportation and use of sold products.
This matters because an organisation can reduce Scope 1 emissions while its overall footprint barely changes.
For example:
| Emissions source | Baseline |
|---|---|
| Scope 1 | 10,000 tCO₂e |
| Scope 2 | 15,000 tCO₂e |
| Scope 3 | 75,000 tCO₂e |
| Total | 100,000 tCO₂e |
Suppose operational improvements reduce Scope 1 by 30%:
10,000×30%=3,000 tCO2e10,000 \times 30\% = 3,000\ tCO₂e
Total emissions become approximately:
100,000−3,000=97,000 tCO2e100,000-3,000=97,000\ tCO₂e
That is only a 3% reduction in total emissions.
The lesson is critical: optimising what is easiest to measure is not necessarily the same as solving the largest sustainability problem.
6. Efficiency Metrics: Measure Both the Numerator and Denominator
One of the biggest mistakes in sustainability reporting is celebrating intensity improvements without examining absolute environmental impact.
Consider a company whose emissions fall from 100,000 to 90,000 tCO₂e while production increases from 1 million to 2 million units.
Baseline:
GHG intensity=100,0001,000,000=0.10 tCO2e/unitGHG\ intensity = \frac{100,000}{1,000,000} =0.10\ tCO₂e/unit
New intensity:
90,0002,000,000=0.045 tCO2e/unit\frac{90,000}{2,000,000} =0.045\ tCO₂e/unit
Intensity has improved by:
0.10−0.0450.10×100=55%\frac{0.10-0.045}{0.10}\times100 =55\%
That sounds excellent.
But absolute emissions only declined by:
100,000−90,000100,000×100=10%\frac{100,000-90,000}{100,000}\times100 =10\%
Both numbers matter.
A credible sustainability dashboard should therefore combine:
- Absolute emissions
- Emissions intensity
- Energy consumption
- Energy intensity
- Water withdrawal and consumption
- Waste generation
- Waste diversion/recycling
- Virgin material consumption
- Recycled-content percentage
- Renewable-energy share
- Product-life extension
- Financial return on sustainability investments
7. Green Innovation Portfolio: What Should Be Prioritised?
A practical organisation can combine the Eisenhower Matrix with a sustainability scoring system.
For example:
Priority Score=0.30(E)+0.25(C)+0.20(S)+0.15(R)+0.10(I)Priority\ Score = 0.30(E) +0.25(C) +0.20(S) +0.15(R) +0.10(I)
Where:
- E = Environmental impact
- C = Cost/financial attractiveness
- S = Scalability
- R = Regulatory or risk reduction
- I = Innovation/strategic advantage
Each variable could be scored from 1 to 5.
Suppose an energy-efficiency programme scores:
- Environmental impact = 5
- Cost attractiveness = 5
- Scalability = 4
- Risk reduction = 4
- Strategic innovation = 3
Then:
(0.30×5)+(0.25×5)+(0.20×4)+(0.15×4)+(0.10×3)(0.30\times5)+(0.25\times5)+(0.20\times4)+(0.15\times4)+(0.10\times3)
=1.50+1.25+0.80+0.60+0.30=1.50+1.25+0.80+0.60+0.30
=4.45/5=\mathbf{4.45/5}
A speculative technology might score highly on strategic innovation but poorly on cost and scalability. Its score might therefore be lower—not because it is unimportant, but because it belongs in a pilot portfolio rather than immediate mass deployment.
This is precisely where the Eisenhower framework becomes valuable.
8. Global Strategies: What the Best Approaches Have in Common
Across sectors and geographies, successful green innovation strategies increasingly share several characteristics.
Efficiency first
Companies identify energy, material and process waste before making large technology investments.
Electrify where practical
Where electricity can replace fossil-fuel combustion efficiently, electrification can reduce operational emissions while enabling greater use of renewable electricity.
Decarbonise electricity
Renewable procurement, on-site generation, storage and grid optimisation can address significant Scope 2 exposure.
Design products for circularity
The focus shifts from end-of-life recycling toward durability, modularity, repairability, reuse and remanufacturing.
Measure the entire value chain
Scope 3 analysis prevents companies from focusing exclusively on emissions inside their own facilities.
Scale proven innovations
The objective is not to accumulate pilot projects. It is to identify which pilots can become economically viable at scale.
9. The Green Innovation KPI Dashboard
A mature sustainability strategy should connect environmental metrics to operational and financial metrics.
| Dimension | KPI | Example target |
|---|---|---|
| Carbon | Absolute GHG emissions | -30% |
| Carbon | GHG intensity | -40% |
| Energy | Energy intensity | -20% |
| Renewable energy | Renewable electricity share | 70% |
| Materials | Virgin material consumption | -25% |
| Circularity | Recycled material input | 40% |
| Waste | Waste to landfill | <5% |
| Water | Water intensity | -20% |
| Finance | Sustainability project payback | <4 years |
| Innovation | Revenue from green products | 20% |
| Resilience | Critical suppliers assessed | 100% |
The precise targets should be based on the organisation’s sector, baseline, geography and climate strategy rather than copied mechanically.
The important principle is traceability: every sustainability target should have a baseline, unit, timeframe, responsible owner and measurement methodology.
10. The Strategic Test: Impact, Not Greenwashing
The final quadrant of the Eisenhower Matrix is perhaps the most important.
A sustainability activity should be questioned if it has:
- No measurable environmental outcome
- No meaningful connection to material impacts
- No credible baseline
- No transparent methodology
- Little connection to business or stakeholder risk
- Excessive emphasis on marketing relative to actual performance
The objective isn’t to produce the most impressive sustainability presentation.
It is to produce the largest credible improvement per unit of capital, energy, material and management attention.
That is the essence of green innovation.
Conclusion: From Sustainability Intent to Innovation Discipline

The Eisenhower Matrix offers an uncomplicated but powerful way to rethink sustainability strategy.
Quadrant I says: fix today’s waste.
Quadrant II says: build tomorrow’s low-carbon business.
Quadrant III says: simplify activities that consume attention without proportional impact.
Quadrant IV says: stop doing things merely because they look green.
From energy efficiency and renewable power to circular design, electrification and advanced low-carbon technologies, global green innovation is becoming increasingly sophisticated. Yet sophistication should not be confused with complexity.
The strongest sustainability strategy is often the one that can answer five straightforward questions:
- What environmental problem are we solving?
- How large is the baseline impact?
- What innovation changes the underlying system?
- What is the financial and environmental return?
- How will we prove that the improvement actually happened?
As Jaiguru Kadam’s subject-matter perspective emphasises, green innovation should ultimately be treated not as a collection of isolated environmental projects, but as a portfolio of measurable productivity, resilience, resource-efficiency and growth opportunities.
The future belongs to organisations that can move quickly on today’s sustainability problems while investing patiently in tomorrow’s transformative solutions.
Frequently Asked Questions
What is the Eisenhower Matrix?
The Eisenhower Matrix is a prioritisation framework that divides activities according to whether they are urgent and/or important. For sustainability, it can be adapted to prioritise initiatives according to environmental impact, business urgency and strategic value.
What is green innovation?
Green innovation refers to new or significantly improved products, processes, technologies or business models that reduce environmental impacts or improve resource efficiency while creating economic or social value.
What is sustainability efficiency?
Sustainability efficiency means delivering the same—or greater—economic output with fewer environmental inputs such as energy, water, raw materials and carbon emissions.
What does CO₂e mean?
CO₂e, or carbon-dioxide equivalent, converts different greenhouse gases into a common unit based on their climate impact. It allows emissions from gases such as methane and nitrous oxide to be represented alongside CO₂.
What are Scope 1, 2 and 3 emissions?
Scope 1 covers direct emissions from sources an organisation owns or controls. Scope 2 covers emissions associated with purchased energy. Scope 3 covers other indirect emissions throughout the value chain.
What is carbon intensity?
Carbon intensity measures greenhouse-gas emissions relative to an activity or output—for example, tonnes of CO₂e per tonne of product or kg CO₂e per unit of revenue.
What is circular economy?
A circular economy seeks to keep products and materials in use for as long as possible and reduce dependence on virgin resources. It includes strategies such as reduction, reuse, repair, remanufacturing and recycling.
Is recycling the same as circularity?
No. Recycling is one component of circularity. A genuinely circular strategy also considers product longevity, repairability, reuse, material reduction and the substitution of virgin materials.
What is a PPA?
A Power Purchase Agreement (PPA) is a contractual arrangement in which an electricity buyer agrees to purchase electricity from a power producer under defined commercial conditions such as price, volume and duration.
How should a company decide which green innovation to fund first?
Start with the largest measurable environmental impacts, then evaluate financial return, implementation risk, scalability, regulatory exposure and strategic value. Immediate efficiency opportunities generally deserve rapid action, while transformational technologies may require staged pilots and longer-term investment.
What is the most important sustainability metric?
There is no universal single metric. A robust system combines absolute GHG emissions, emissions intensity, energy and material efficiency, water, waste, circularity and financial performance. The correct metrics depend on the company’s sector and material impacts.
If you’d like, I can also make the article more authoritative and publication-ready for LinkedIn/Medium, with a stronger executive tone and a more prominent Jaiguru Kadam thought-leadership voice.